Thanks to Lane Bishop, we’re continuing to keep a close watch on water levels in the Belleisle area as the 2025 freshet progresses.
Flood season is winding down across the watershed. As of this update, RiverWatch has been discontinued for the season, and while water levels are still slightly above summer lows, they’re expected to gradually recede over the coming weeks.
This marks the end of active flood monitoring unless something unexpected rolls through. Our next update will arrive in early July with a complete season recap for your reference.
Stay safe and stay tuned for the full freshet summary coming soon!
![]() Plot Explanations:
Plot Explanations:
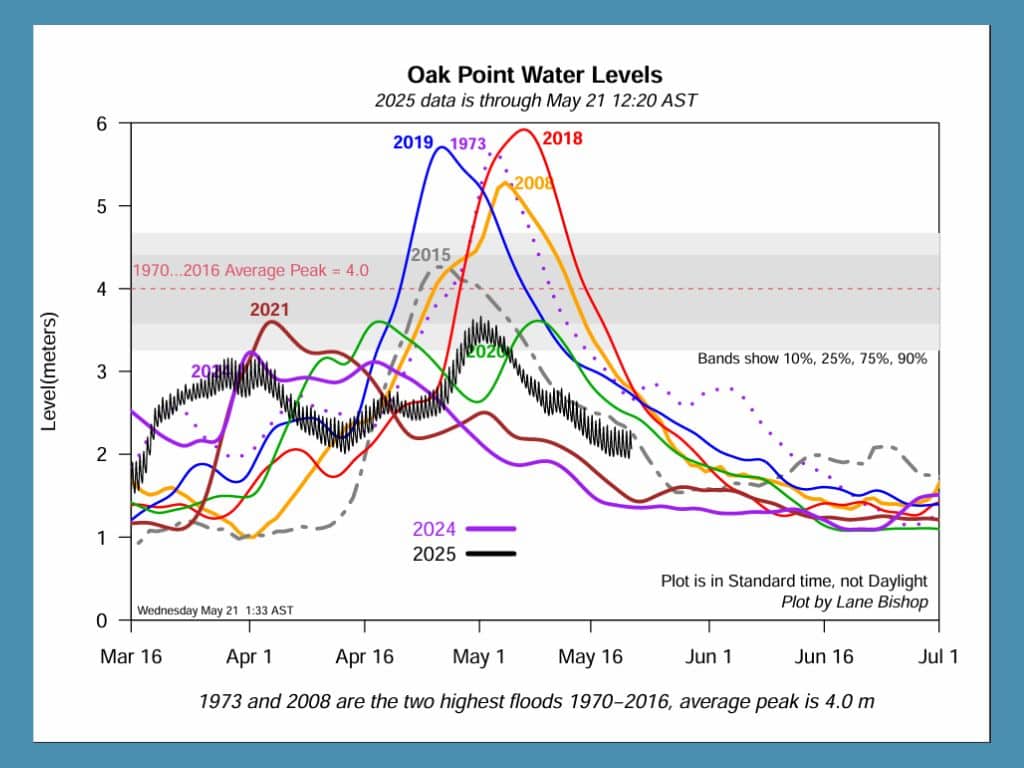
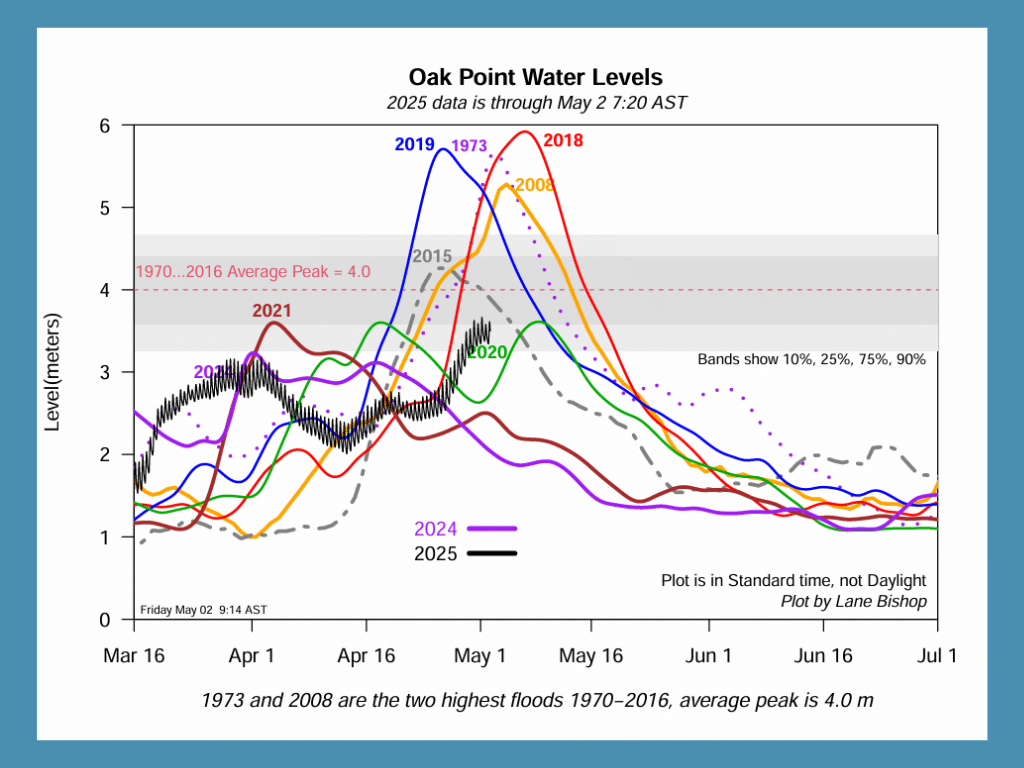
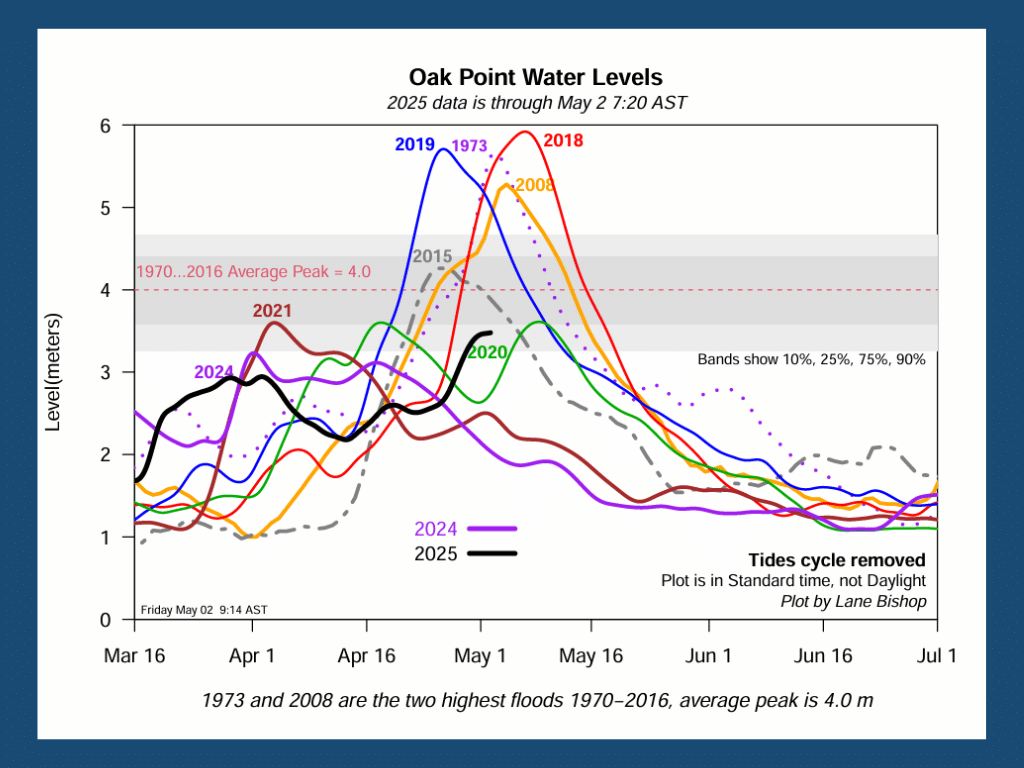
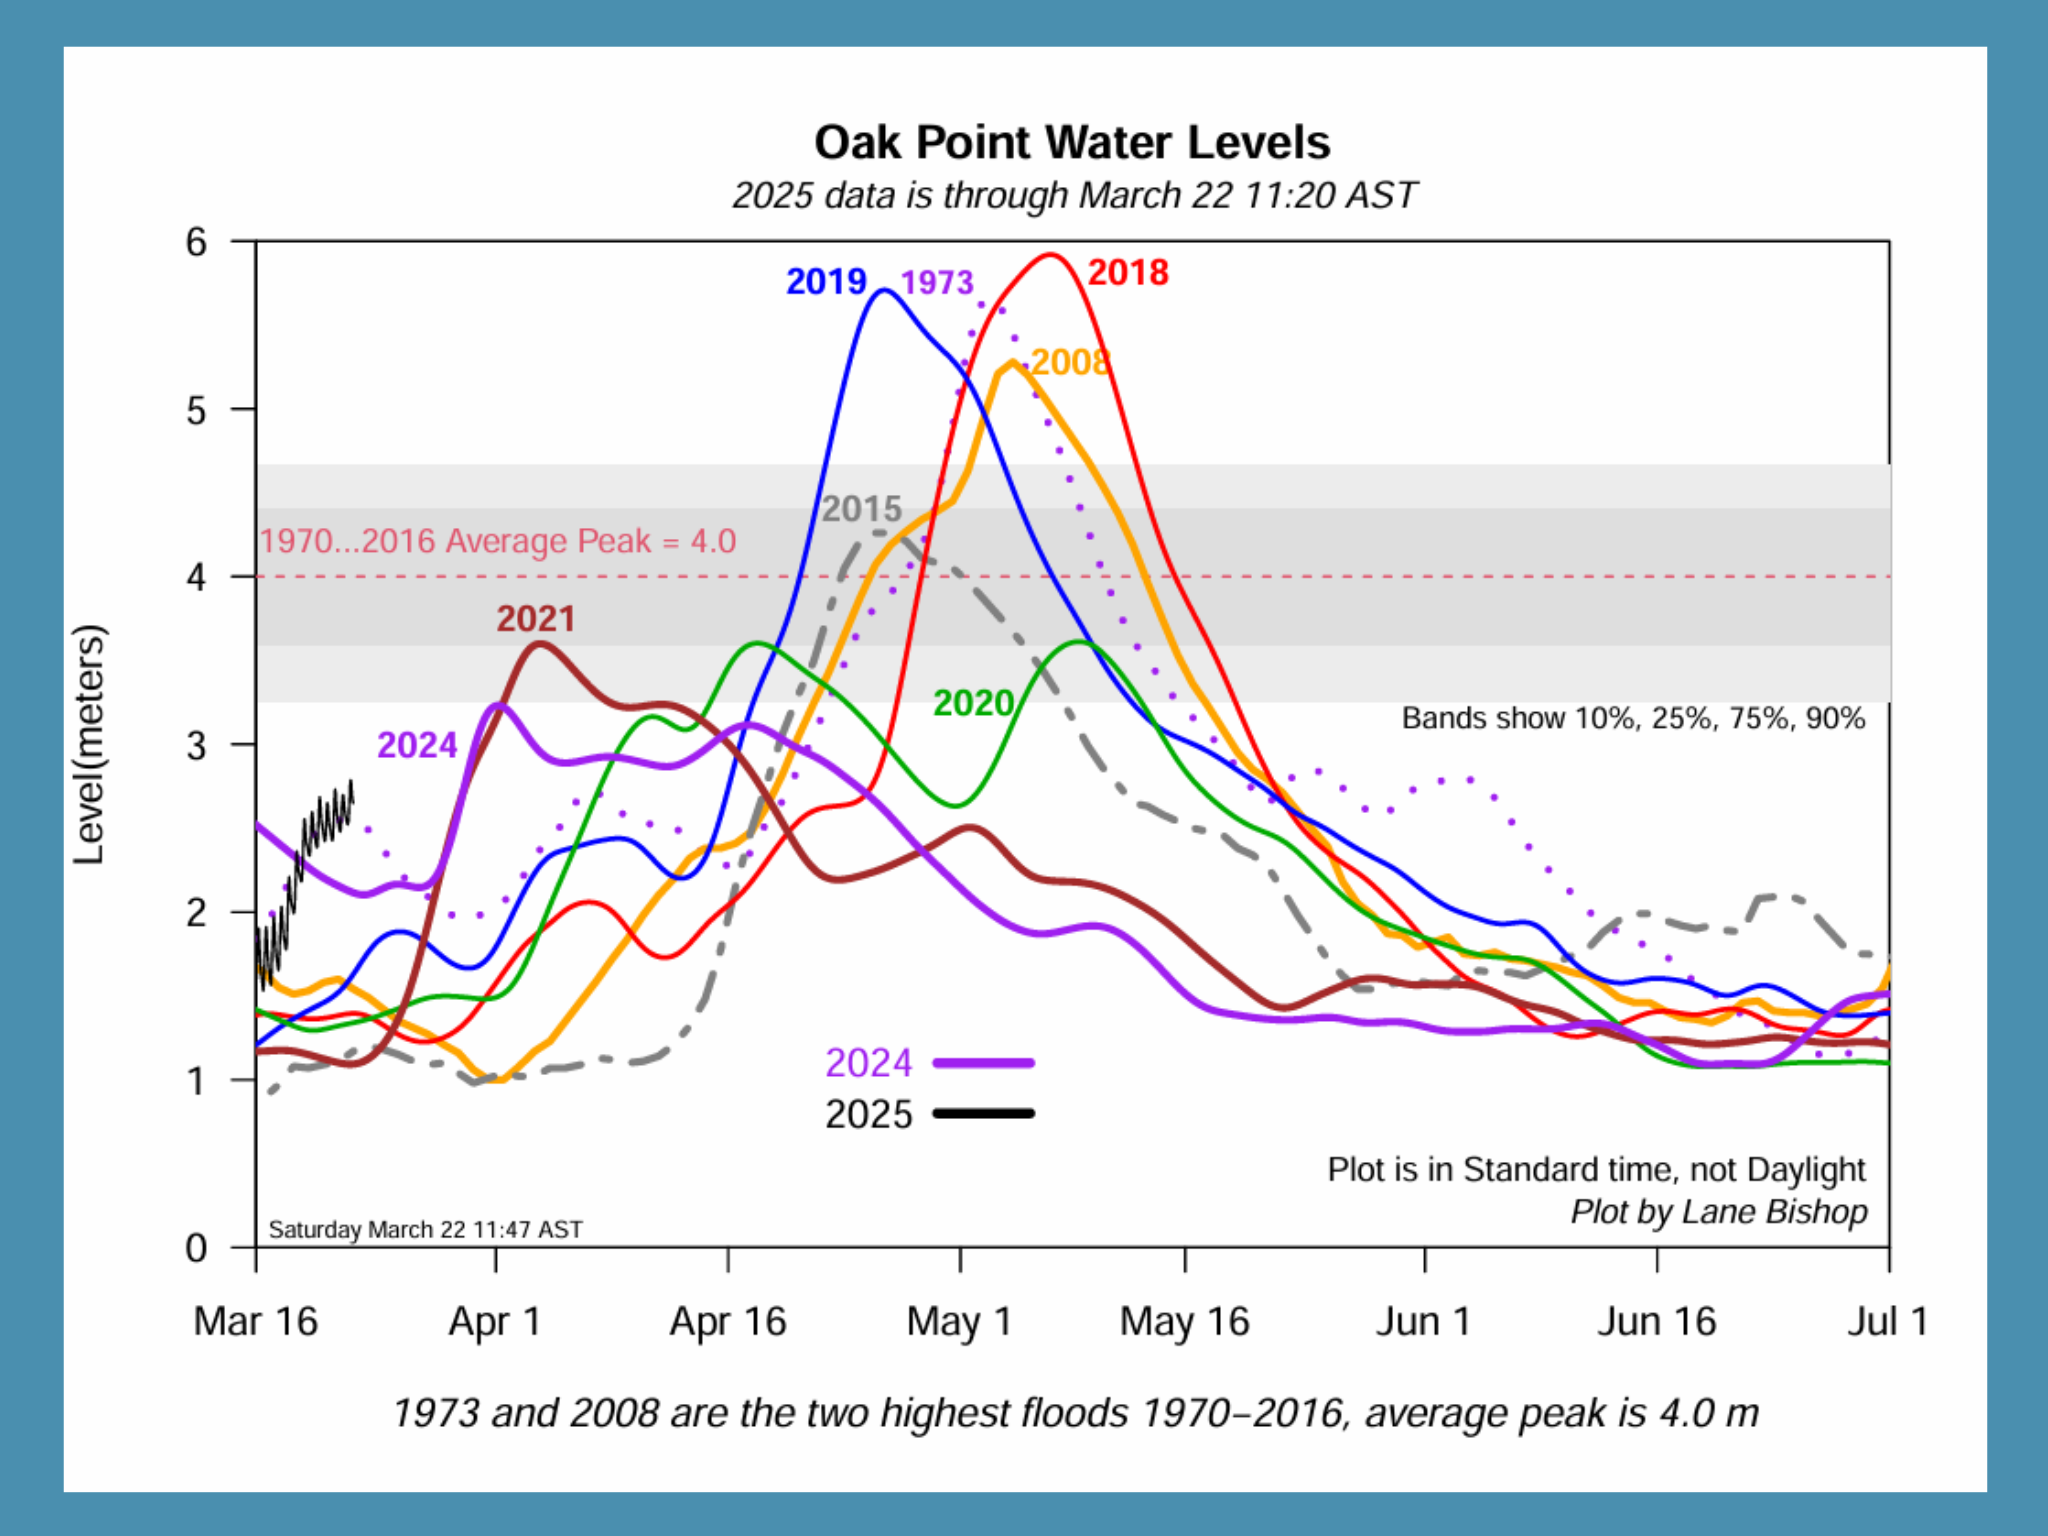
First plot: For 2025, this is the standard plot of water levels using data at 5-minute intervals from the Oak Point hydrometric station on the Saint John River at the mouth of the Belleisle. See:
The lines for the other years have the tidal effect removed (the Bay of Fundy tides push the water back a bit up the Saint John River).
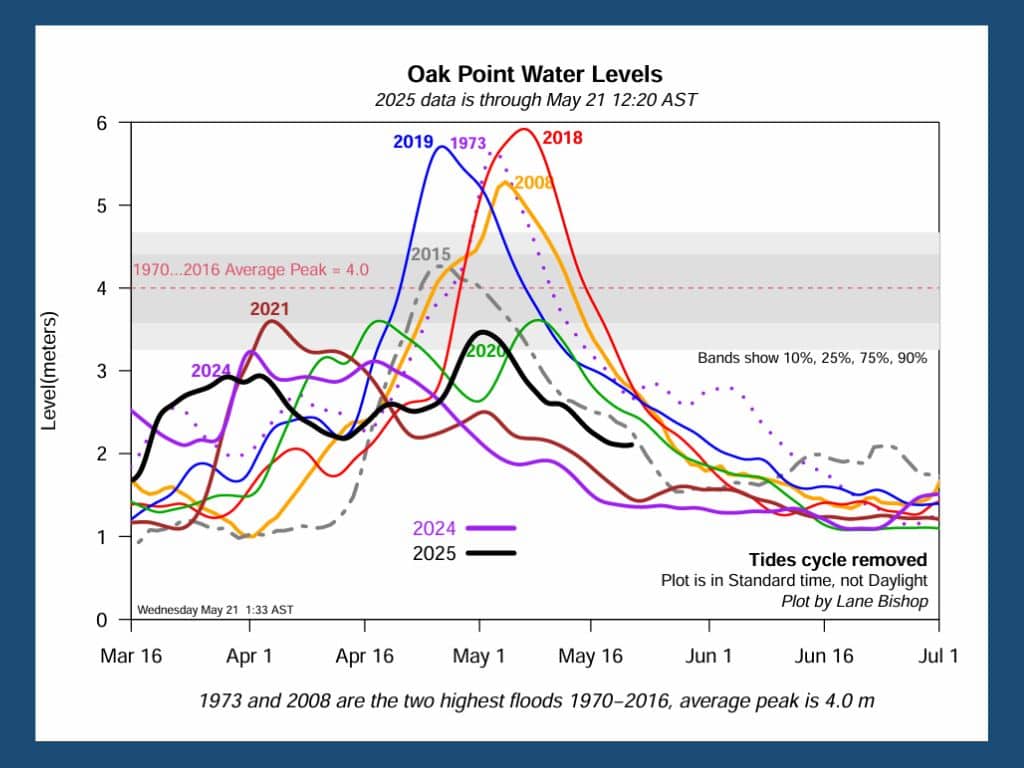
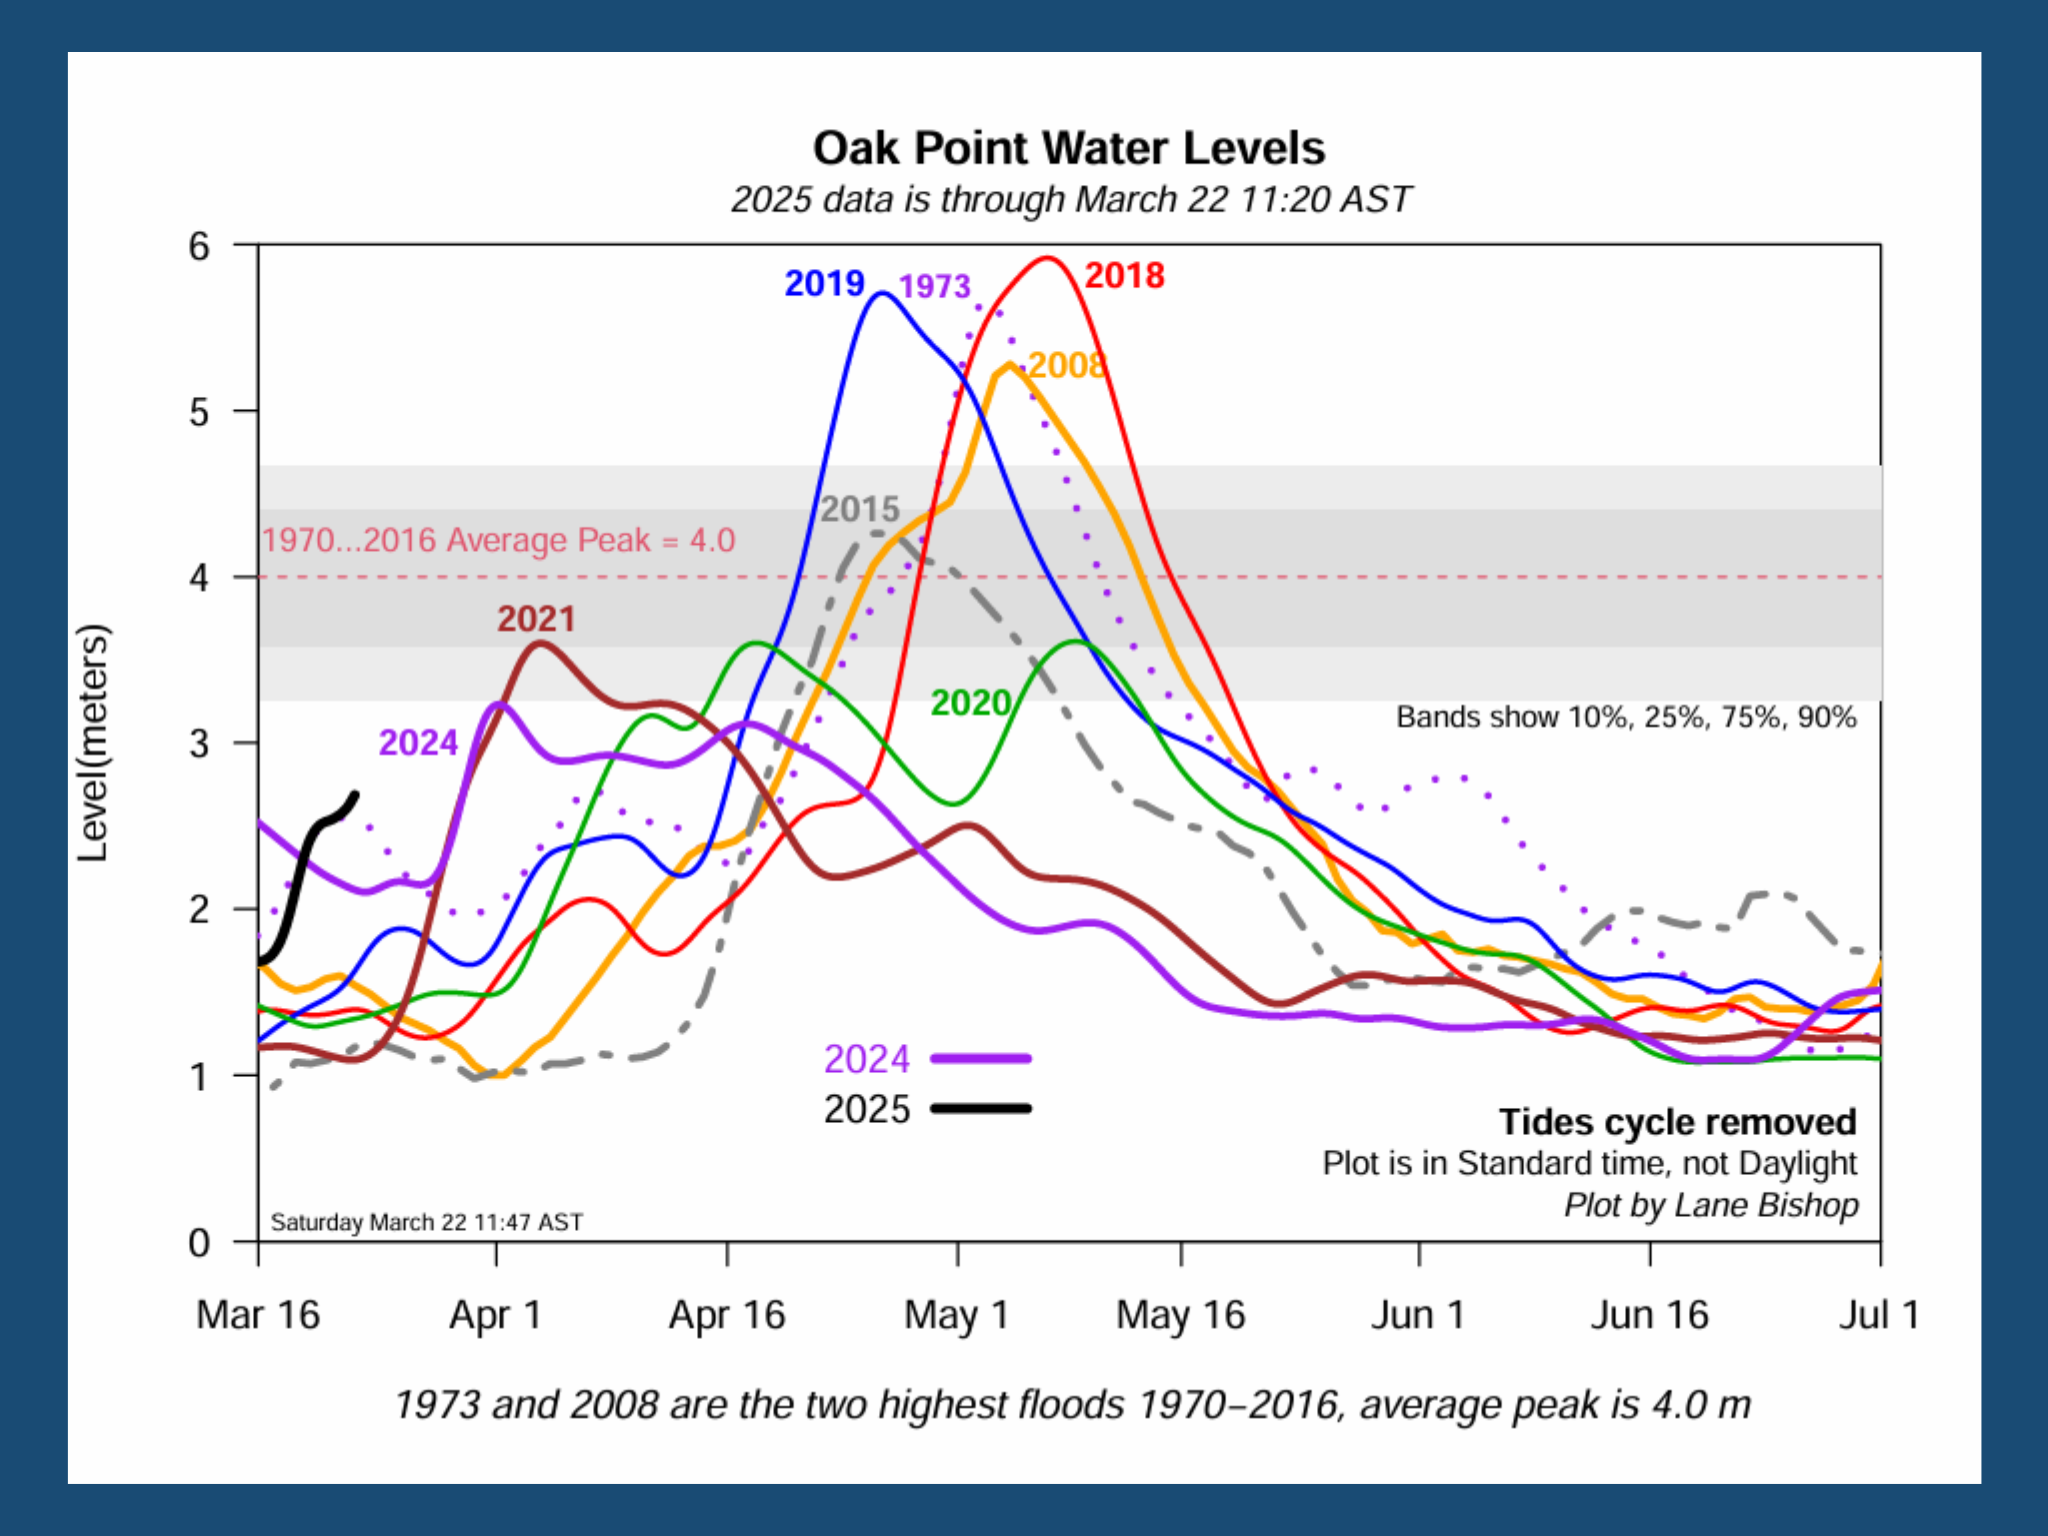
Second plot: This plot has the tidal effect removed from the 2025 data as well.
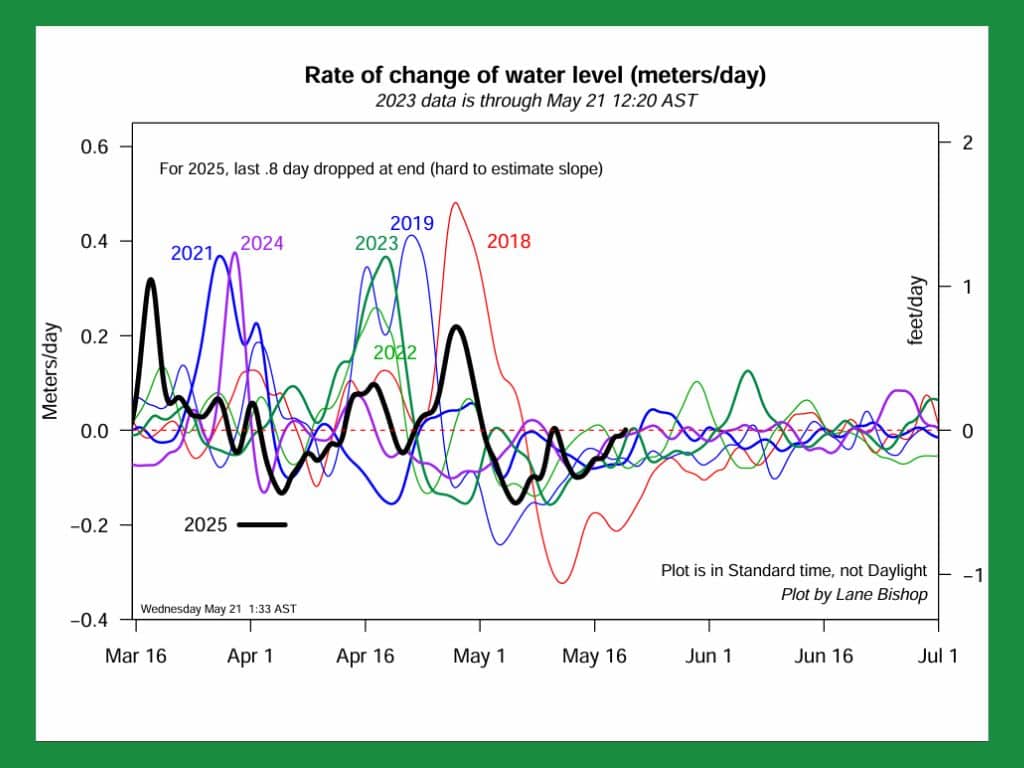
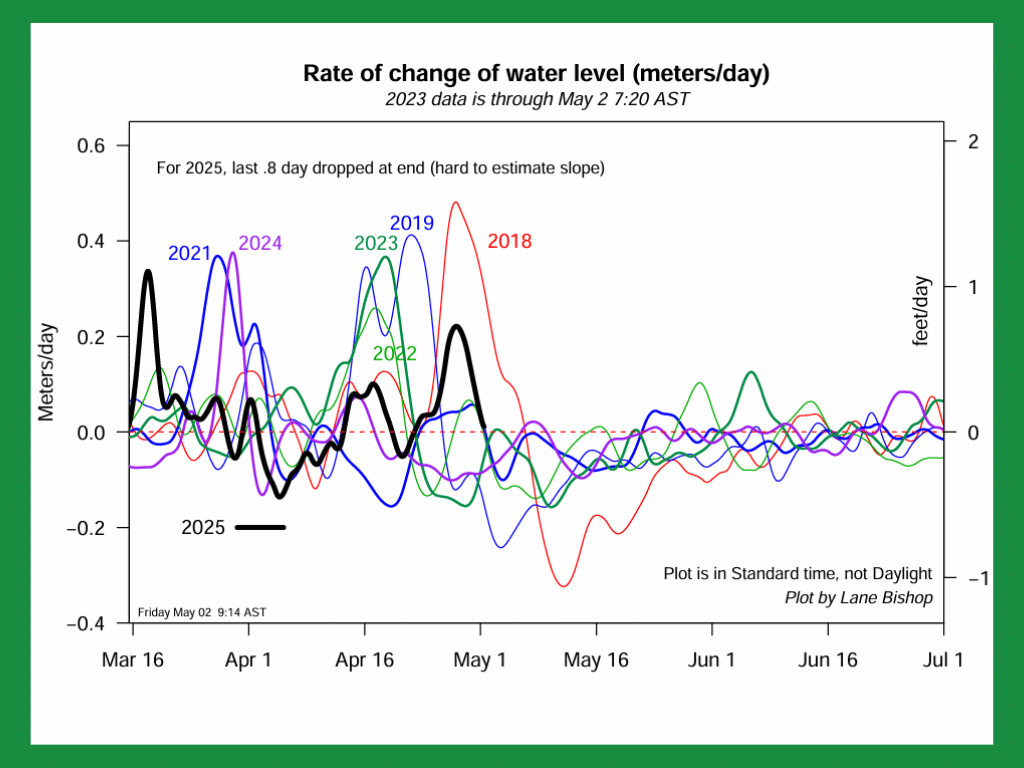
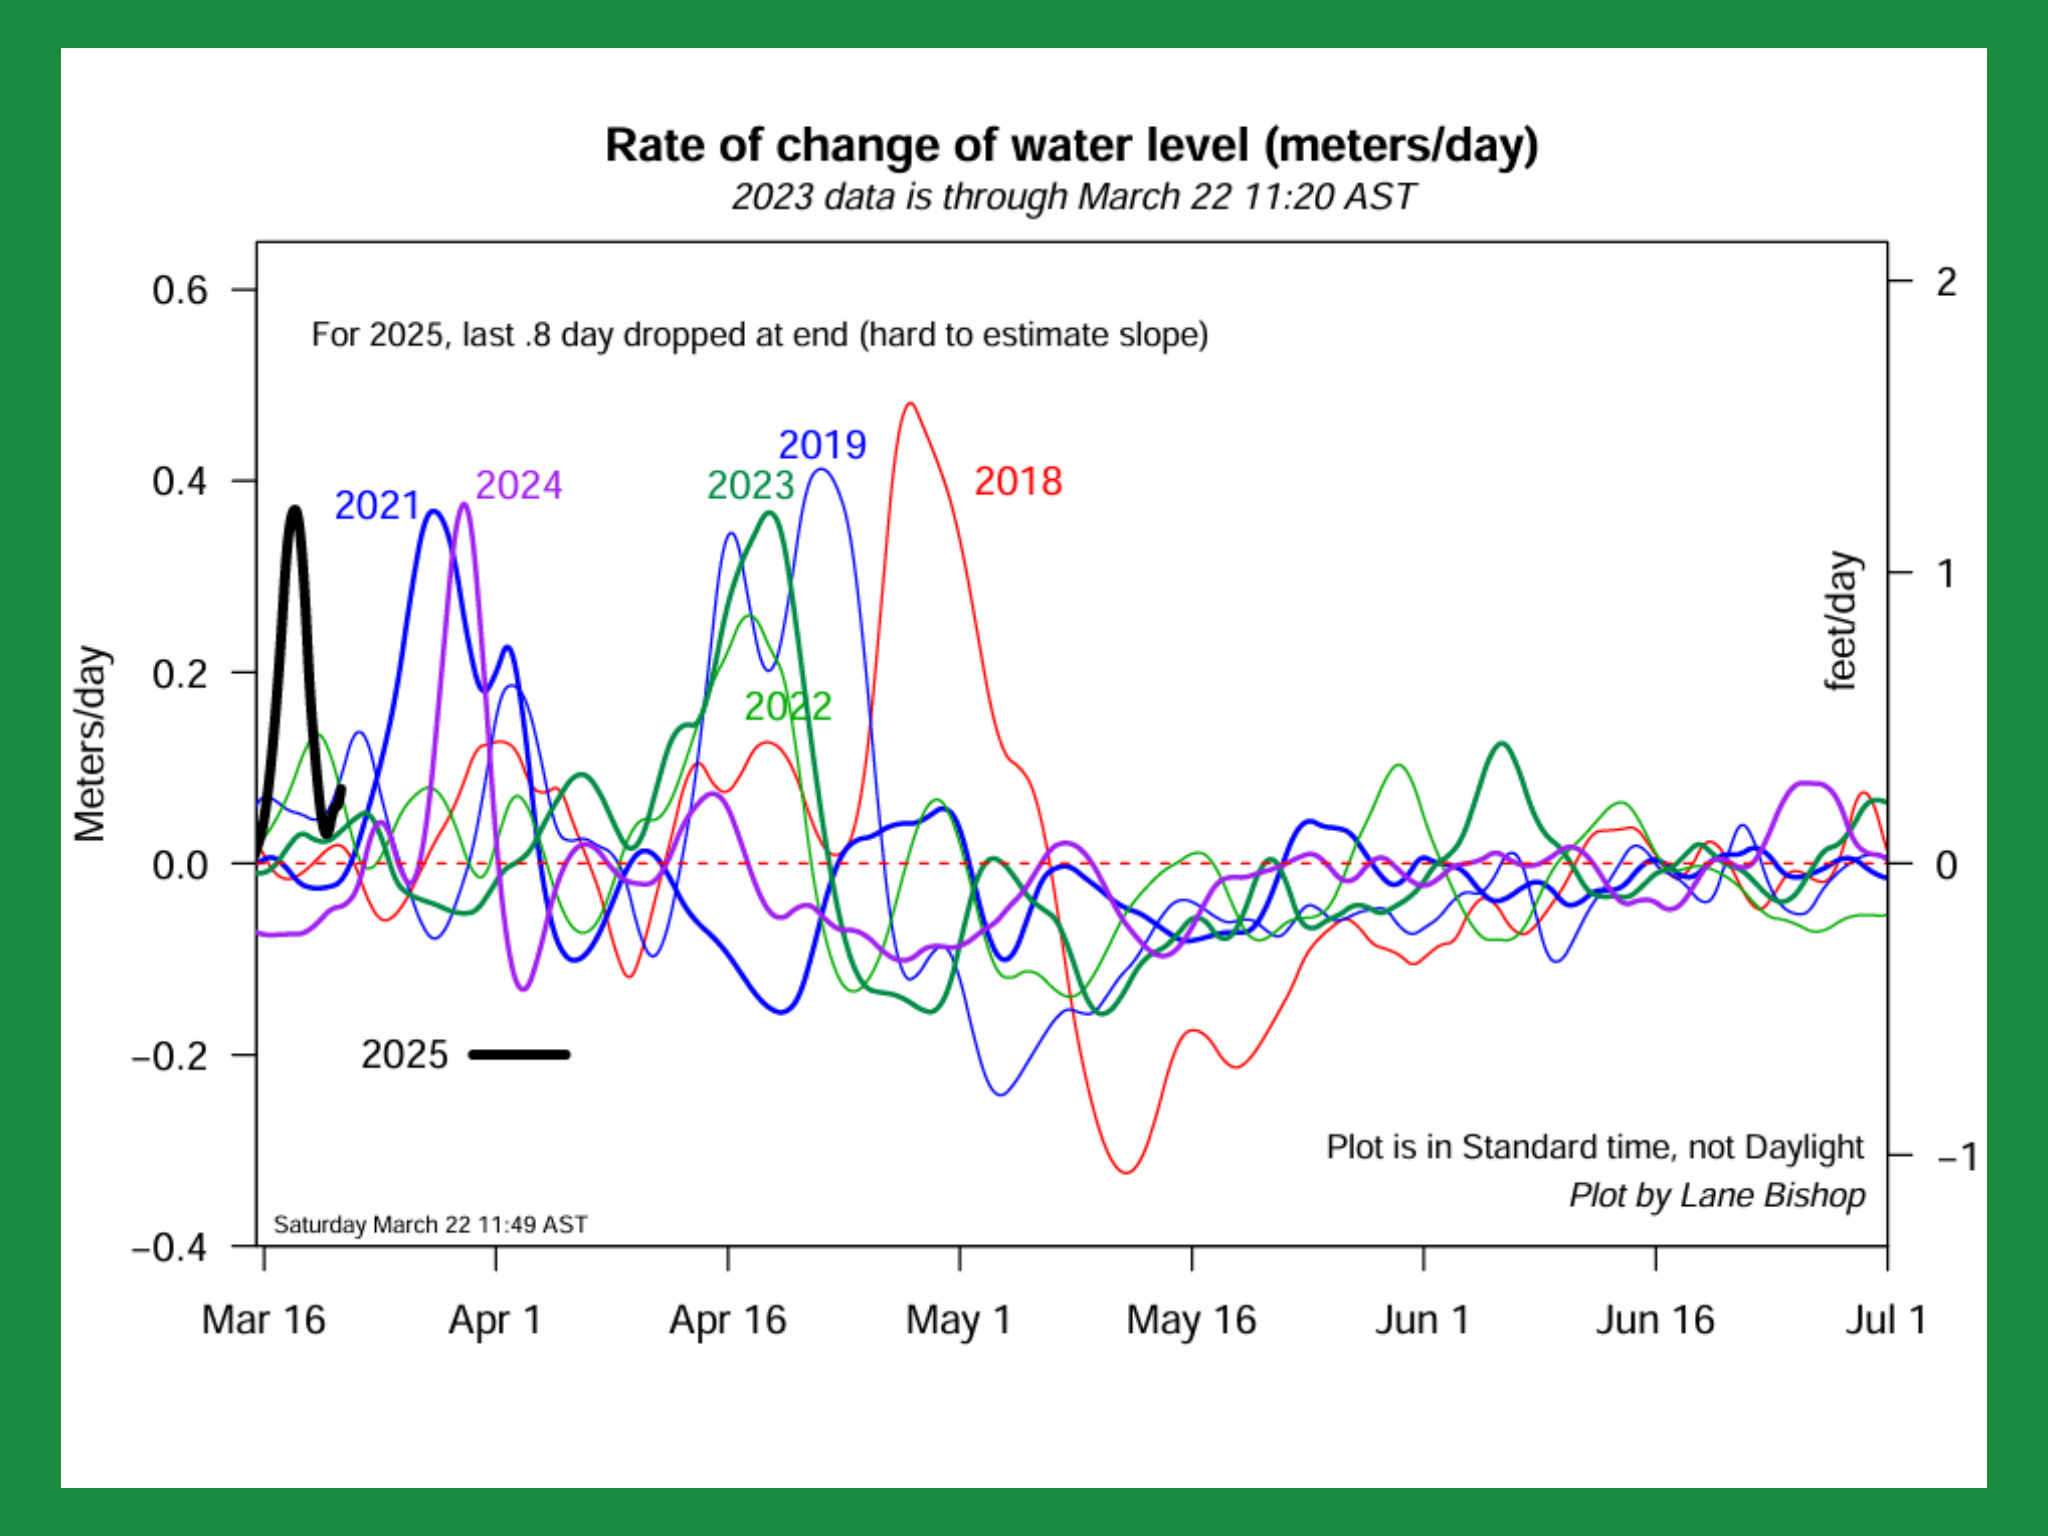
Third plot: Of concern to all of us is not only how high the water levels are right now, but how fast is the water rising? So the left-side scale up the vertical axis shows how fast the water is rising, measured in meters per day (the right-side scale shows feet/day). For the old-timers, 0.3 meters/day is 1 foot/day.