Thanks to Lane Bishop, we’re continuing to keep a close watch on water levels in the Belleisle area as the 2025 freshet progresses.
A big thank you to Lane for his ongoing support and dedication each spring! 
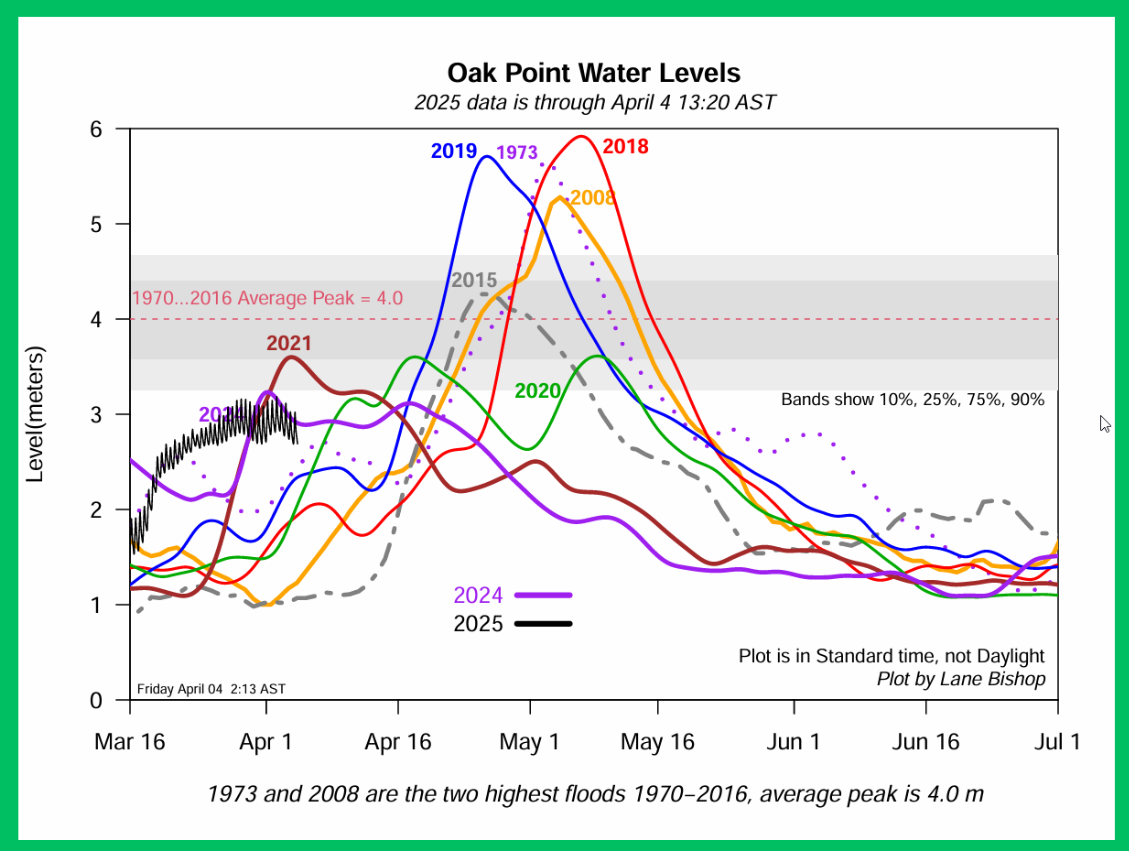
First plot: For 2025, this is the standard plot of water levels using data at 5-minute intervals from the Oak Point hydrometric station on the Saint John River at the mouth of the Belleisle. See:
The lines for the other years have the tidal effect removed (the Bay of Fundy tides push the water back a bit up the Saint John River).
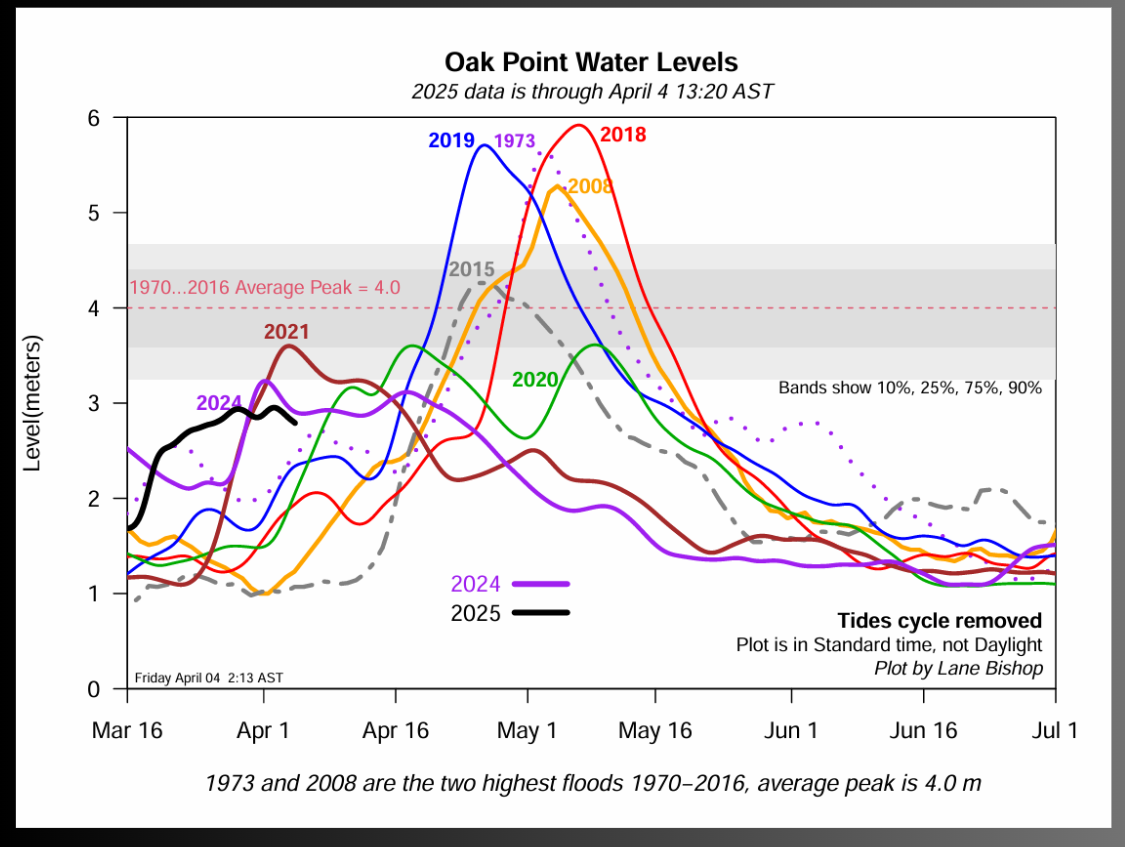
Second plot: This plot has the tidal effect removed from the 2025 data as well.
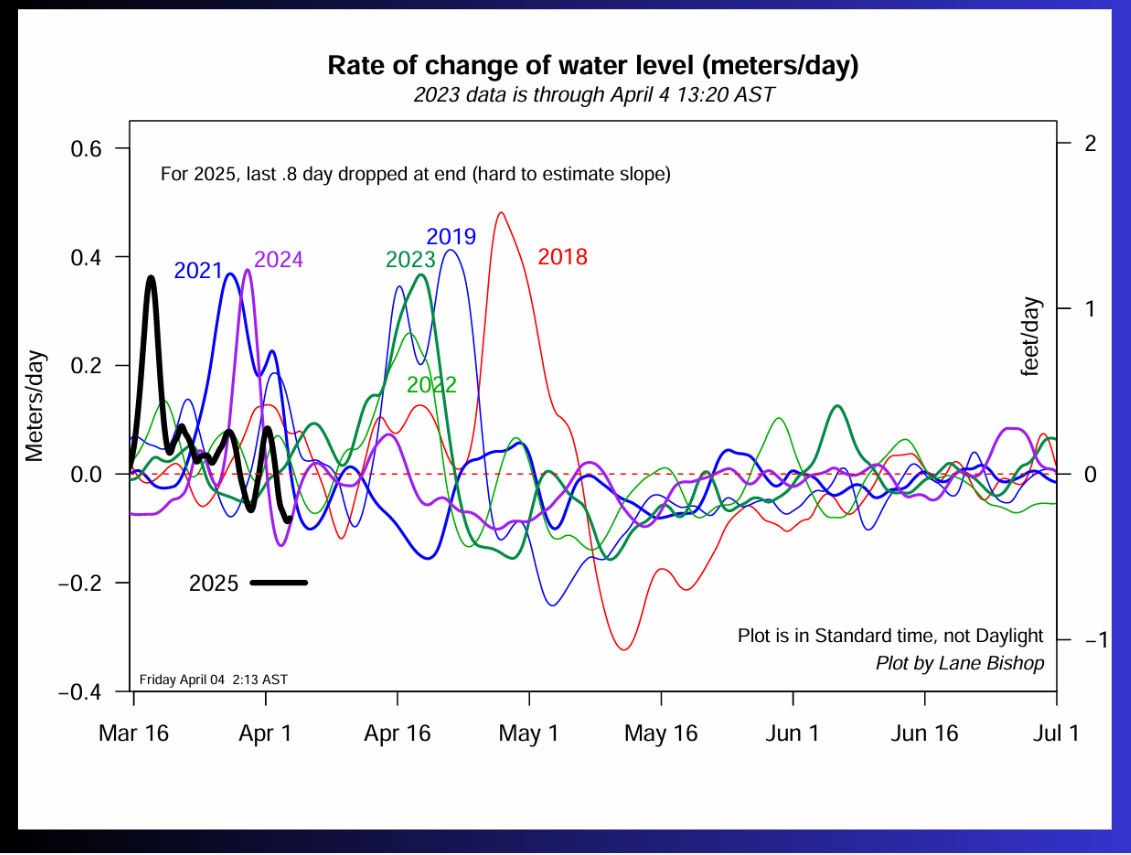
Third plot: Of concern to all of us is not only how high the water levels are right now, but how fast is the water rising? So the left-side scale up the vertical axis shows how fast the water is rising, measured in meters per day (the right-side scale shows feet/day). For the old-timers, 0.3 meters/day is 1 foot/day.