First Freshet Plots for 2025
Hi Folks it’s that time of year when we keep an eagle eye on the river. Again this year a big thanks to Lane Bishop who has kindly provided us with his water level plots for the 2025 freshet. As a reminder, here are the definitions for the plots:
Explanation:
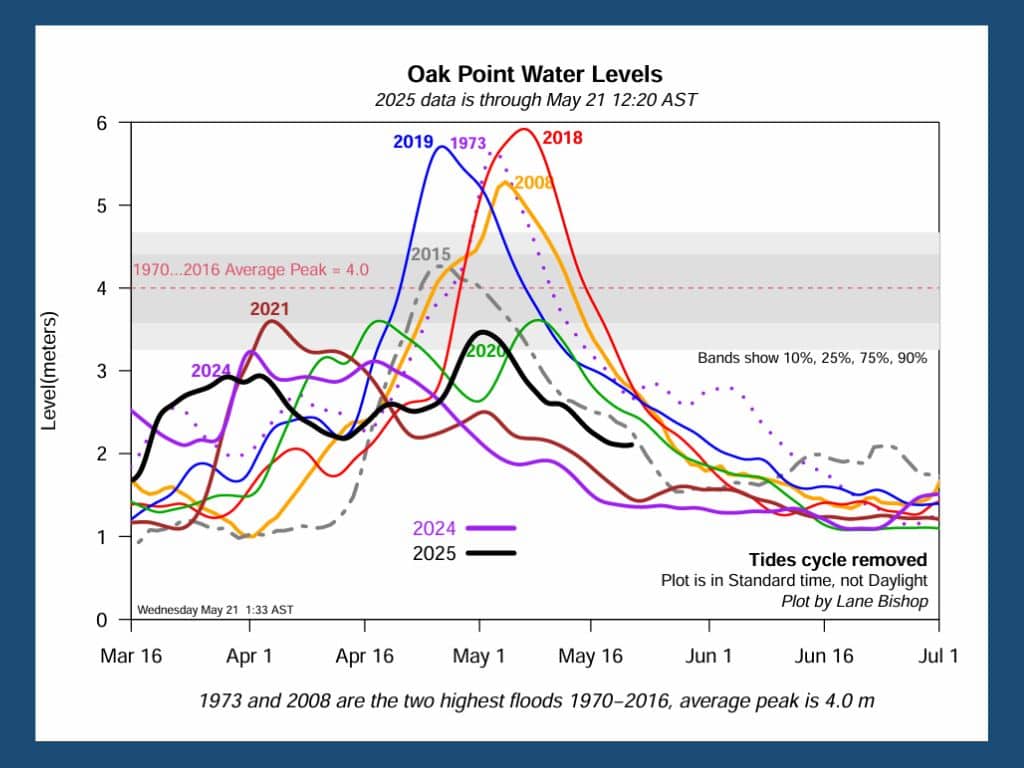
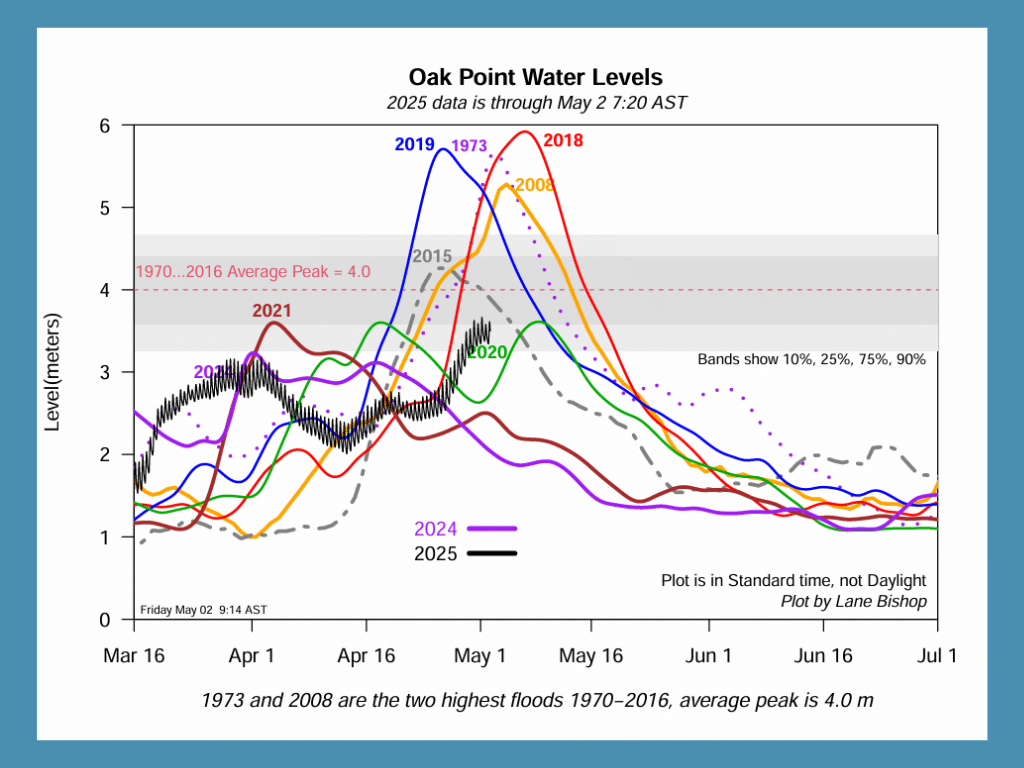
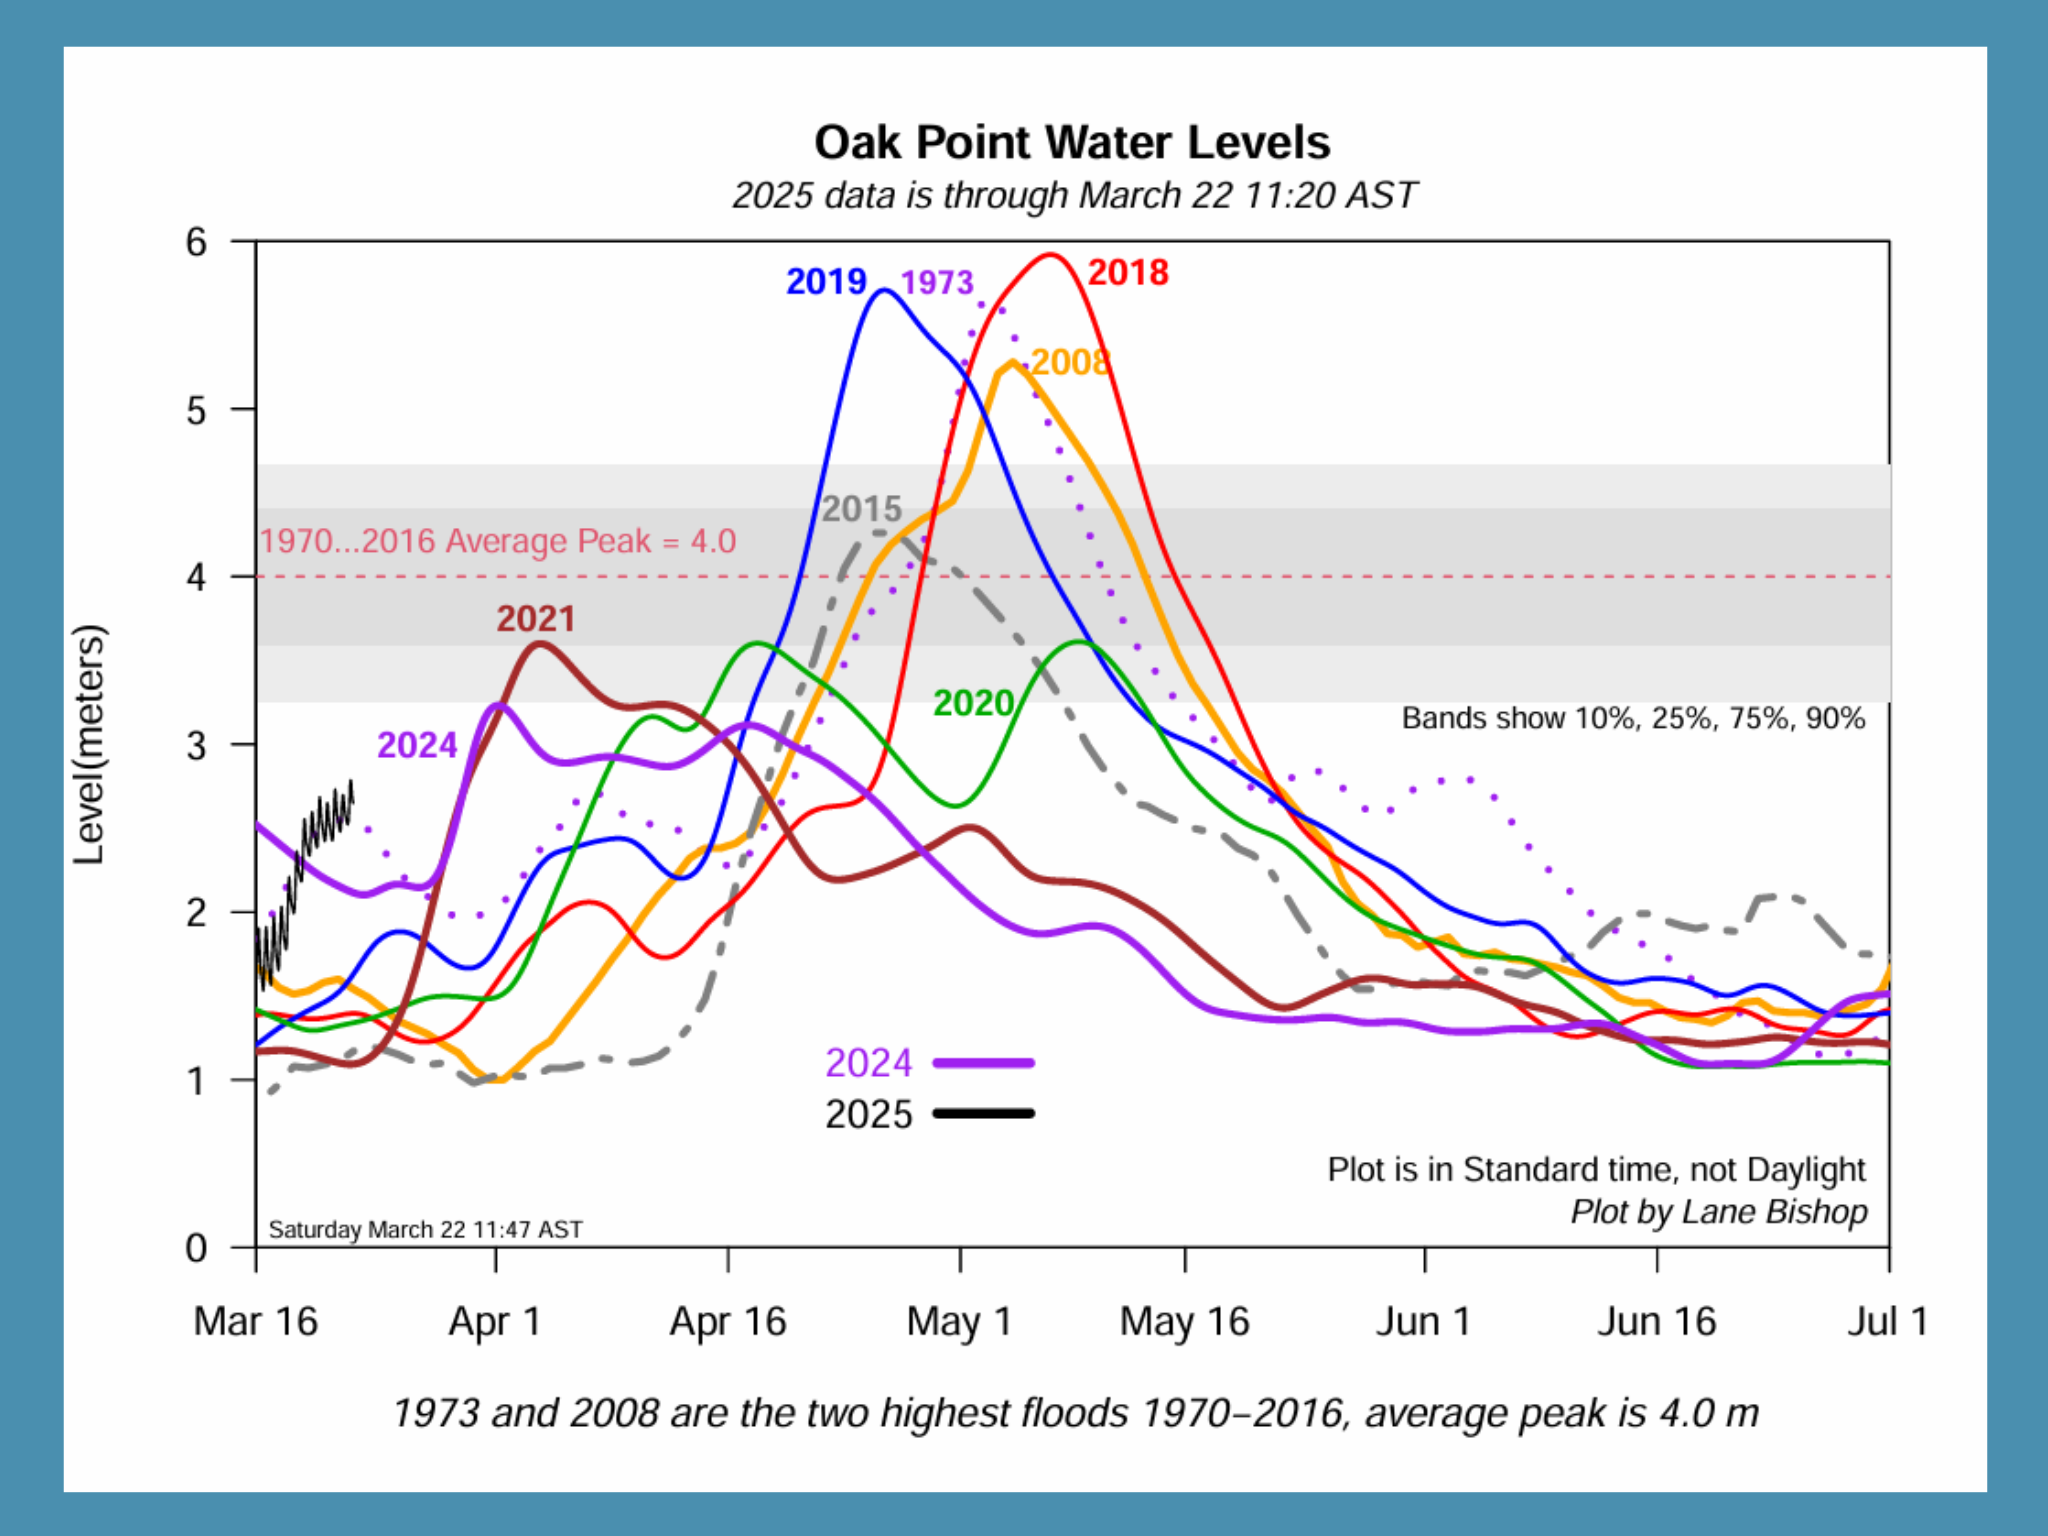
1. First plot: For 2025, this is the standard plot of water levels using data at 5 minute intervals from the Oak Point hydrometric station on the Saint John River at the mouth of the Belleisle. See https://wateroffice.ec.gc.ca/report/real_time_e.html…. The lines for the other years have the tidal effect removed (the Bay of Fundy tides push the water back a bit up the Saint John River).
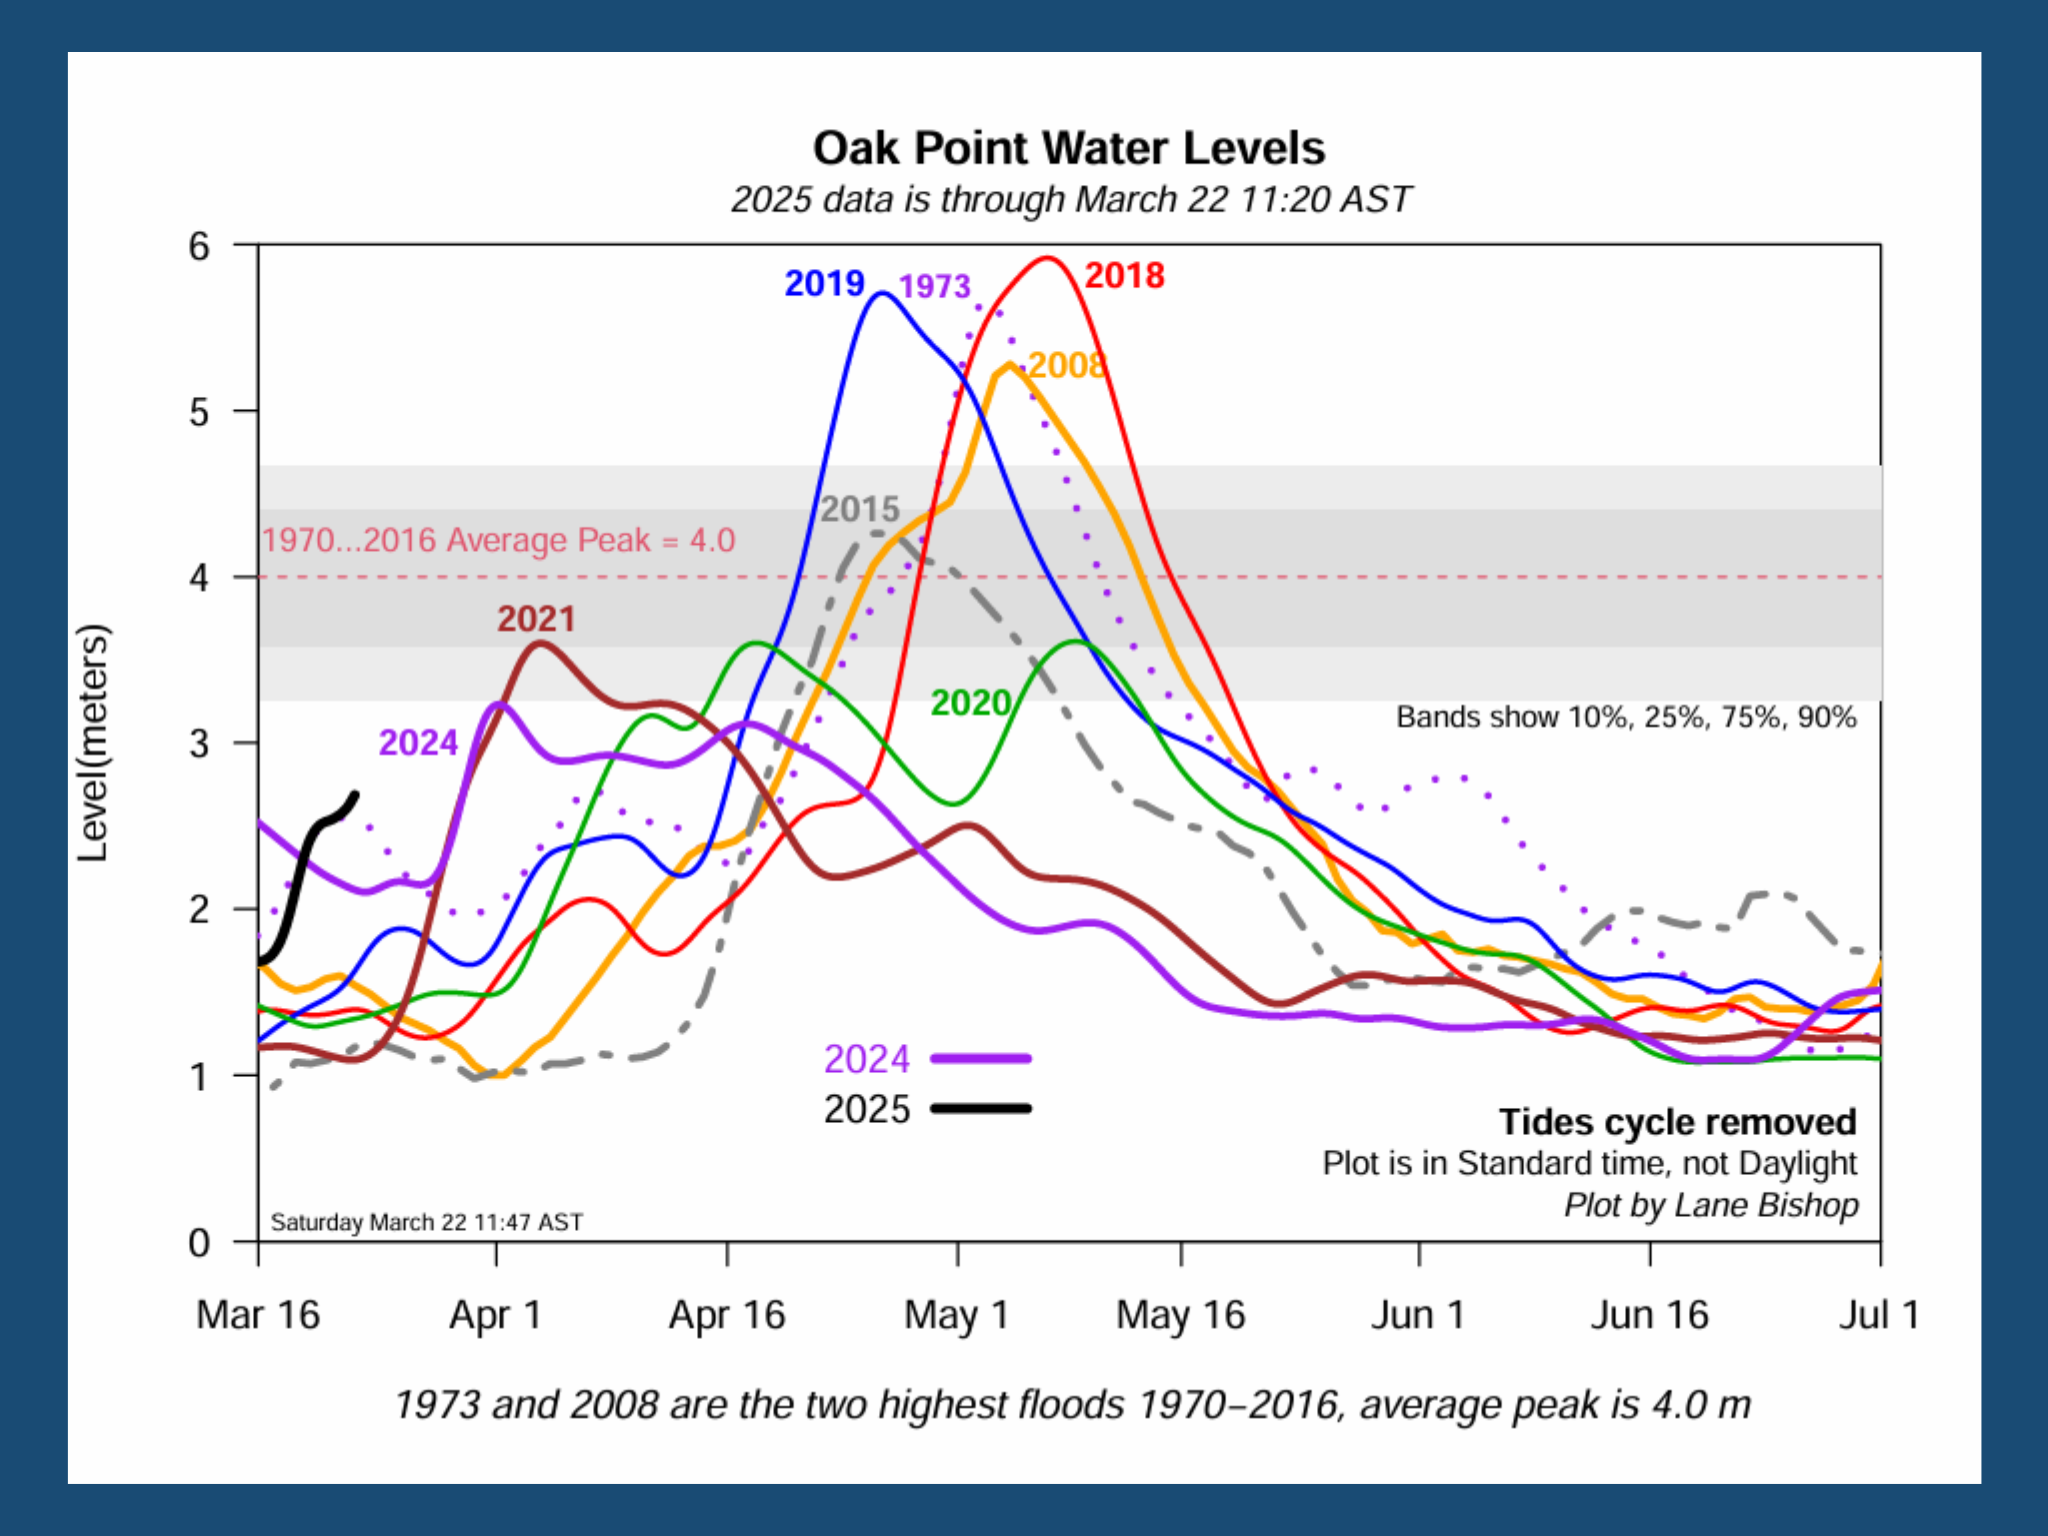
2. Second plot: This plot has the tidal effect removed from the 2025 data as well.
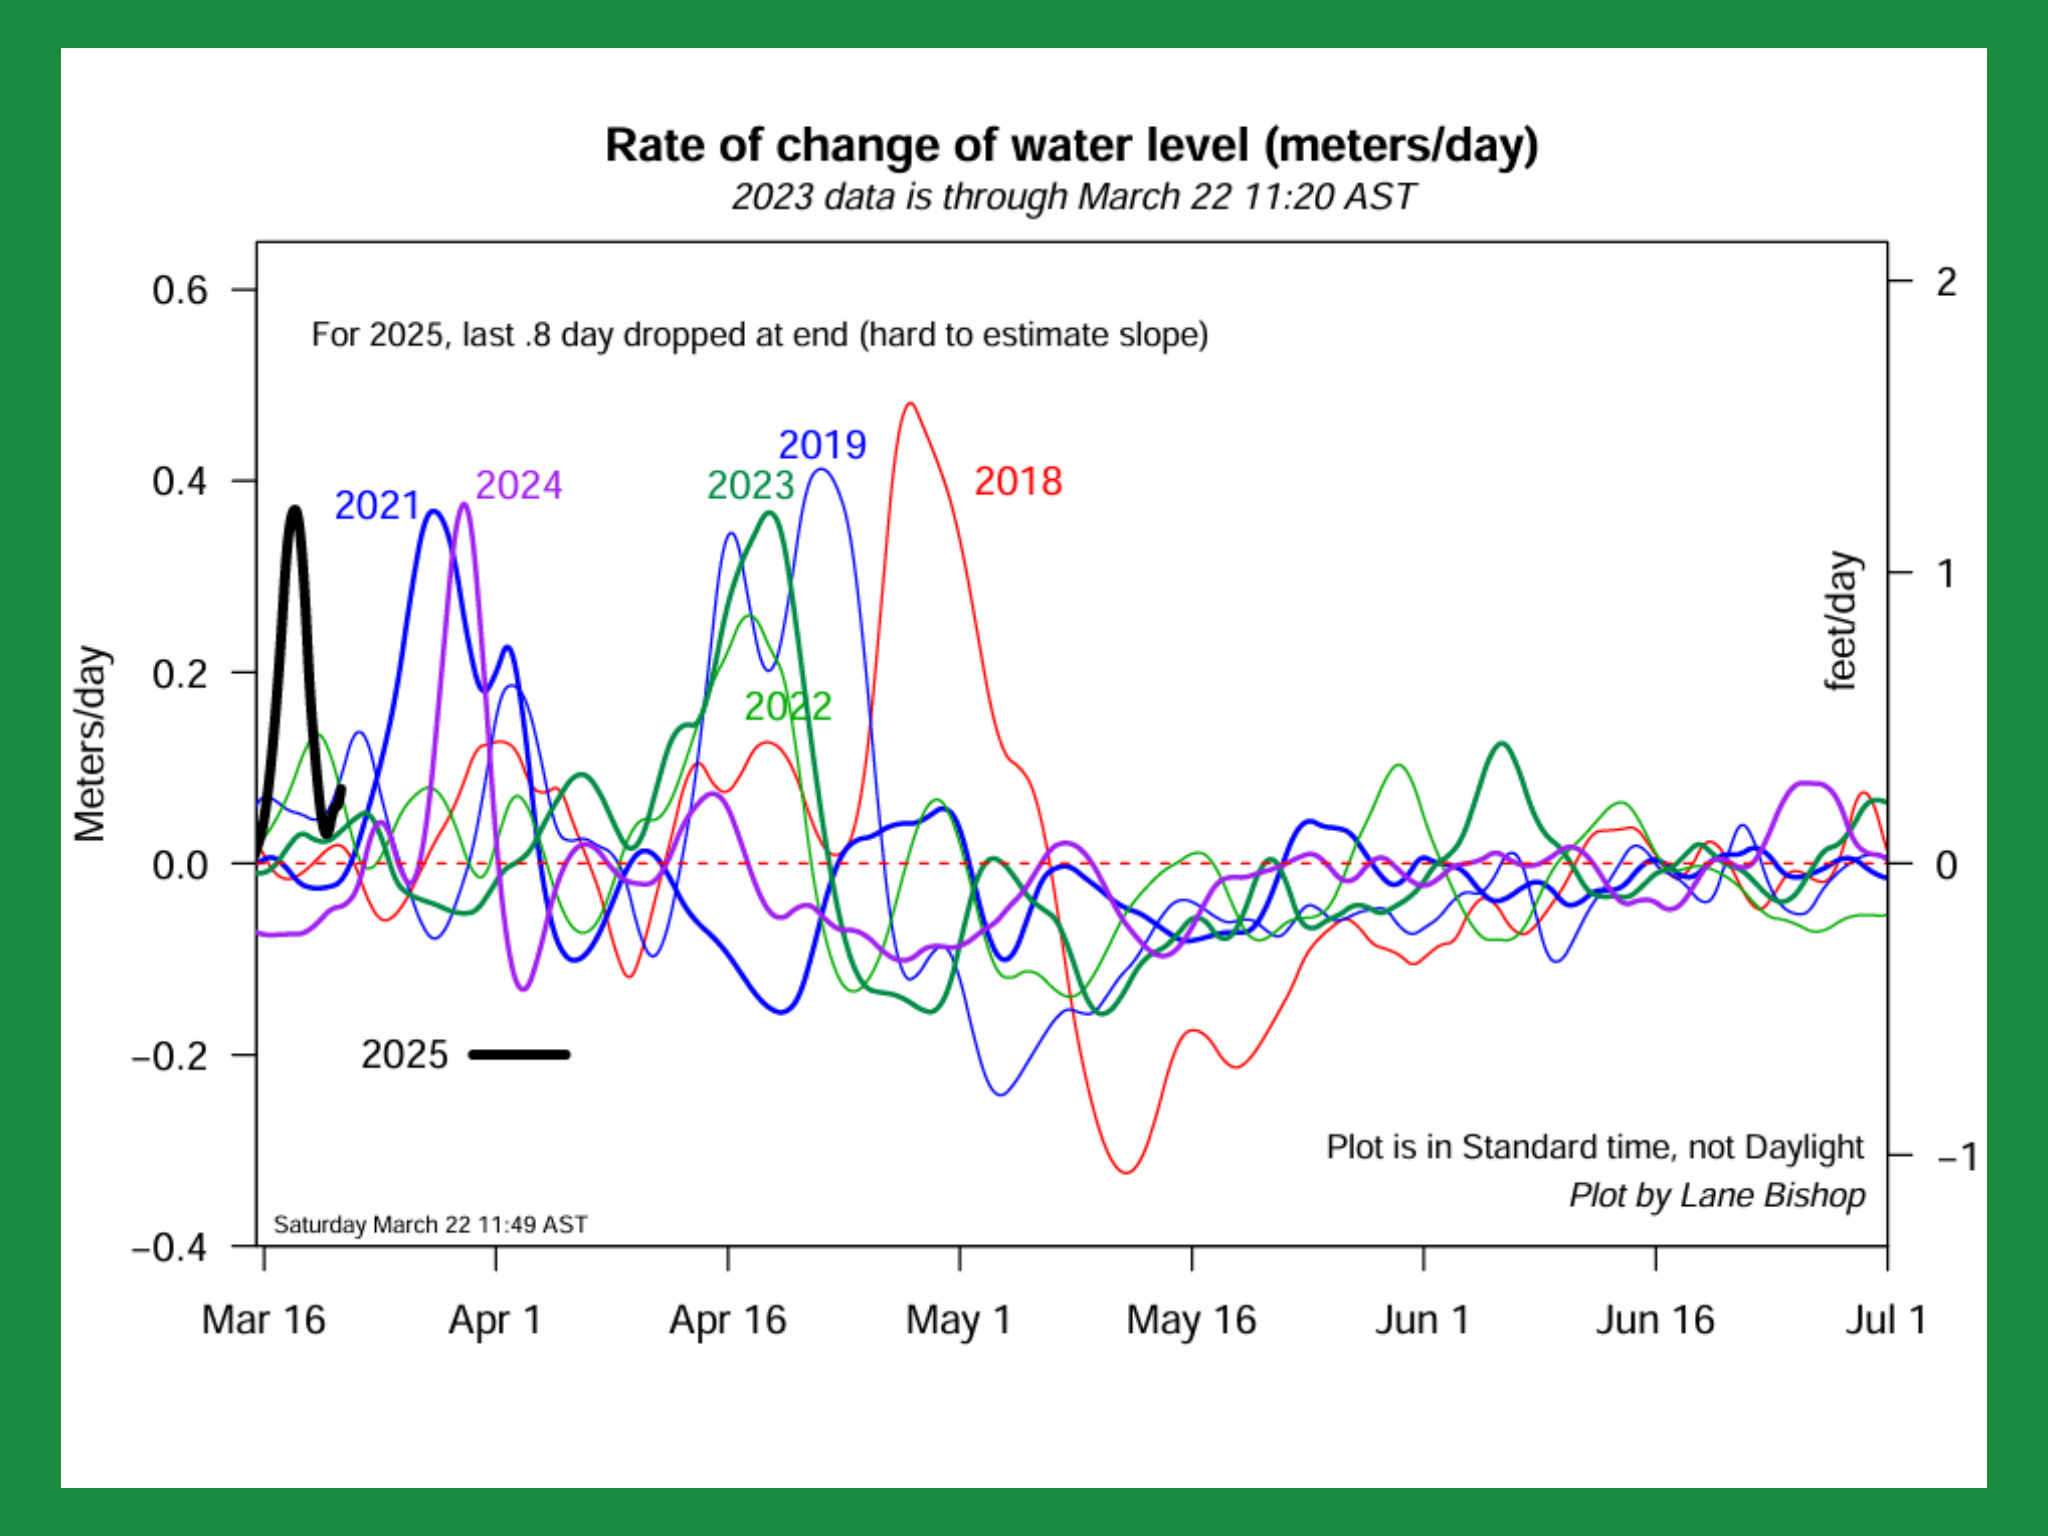
3. Third plot: Of concern to all of us is not only how high the water levels are right now, but how fast is the water rising? So the left-side scale up the vertical axis shows how fast the water is rising, measured in meters per day (the right-side scale shows feet/day). For the old-timers, 0.3 meters/day is 1 foot/day. When the line is high, the water is rising very quickly; when it is below the zero line (red horizontal dashed line), the water is receding.
Water Level Plots credit Lane Bishop – 2025 Freshet